
From Dashboards to Decisions: The Rise of Augmented BI 2026?
Today, the majority of companies have in place dashboards; however, many are still unable to rapidly and confidently make decisions based on those Dashboards to Decisions. The main function of augmented business intelligence (BI) powered by AI is to eliminate the need for passive charts and to provide proactive, decision-ready insights.
Connect With Us: WhatsApp
What does augment BI stand for?
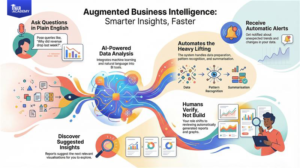
Augmented BI (or augmented analytics in BI) is a concept that signifies the integration of machine learning, natural language, and automation features right into the business intelligence tools. The system does the heavy work of data preparation, locating patterns, and summarizing the business situation without human intervention. Humans only need to verify the output of the system which is to their surprise the system has done everything automatically and is already ready for them to review the provided graphs created from the extracted data from it.
Some of the main features that are generally included in these systems are as follows:
- Using natural language to pose questions and get explanations (such as “Why did revenue drop last week?”).
- Getting notifications for unexpected changes and trends that show up in charts without human intervention.
- By simply viewing the prepared report, one gets the suggested next insight and visualizations instead of just getting to load static reports.
Why dashboards alone are no longer enough
- Regular traditional BI is mostly limited to descriptive analytics, which means it answers the question: “What happened?” When business users have to do the “why” investigation on their own, the speed of decisions drops and new opportunities for profit or growth might get overlooked. Organizations are planning that by the year 2025 their BIs will be able to provide the answers to “why did it happen?” and “what should be done next?” questions directly, with very little interaction needed between business users and data teams.
- It is really vital at this moment because the amount of data is skyrocketing and more and more decisions are made at the edge of a company (for example, frontline sales, operations, and marketing teams). Augmented BI tools are turning into a factor that differentiates one company from another in terms of competitiveness as they are helping to close the bridge between data and timely action.
Concrete use cases: dashboards to decisions
- Generally, there are three examples that you can use to demonstrate the power of augmented business intelligence:
Revenue and pipeline reviews
Augmented BI messengers automatically alert the headquarters of those territories or segments where the sales are not growing as expected. It also points out the causes of changes (e.g. changes in discounting or the channel mix) and proposes the accounts that will bring the company the highest return if it prioritizes them.
Marketing performance
The platform integrates ad sources, web analytics, and CRM data and then issues recommendations aimed at optimizing where to put the next dollar by pinpointing the advertising campaigns that will bring the highest marginal ROI and by forecasting their saturation points.
Operations and finance
The prepared reports bring to the surface, without being requested, cost anomalies, delays in supply, or loss of margin together with “root cause cards” that point to particular SKUs, vendors, or branches. The examples illustrate the transition from “here is the data” to “here is what has changed, why it has changed and what you can do about it”.
How augmented BI changes roles
The implementation of the augmented BI will not result in removing the analysts; rather, it will affect the way in which analysts use their time. Monotonous tasks of creating slices, preparing reports, and doing “can you pull this graph?” type of requests will progressively be taken over by AI layers and self-service interfaces.
Professional skills of analysts and data scientists will be employed for more complex work such as:
Setting up the metrics and semantic layers. Data quality and definitions management. Collaborating on the implementation of advanced models and experimentation. Corporate users will have a lift in their self-reliance: they will be able to pose questions in their natural language, interact with changing explanations, and execute insights at a faster rate without having to wait in long reporting queues.
Connect With Us: WhatsApp
Getting started with augmented BI
A blog post that you can wrap up mentioning the practical adoption path would look like this:
- Initiate with one Dashboards to Decisions that has a significant impact (for example, weekly executive or revenue review) and activate augmented features like automated insights and NLQ.
- Agree on a semantic layer and KPIs so that the AI-generated insights use the same definitions.
- Business users should be trained to consider AI output as decision support, not absolute truth; also, they should be encouraged to check the validity themselves and pose subsequent questions.
- GTR Academy