
Confusion Matrix – Precision, Recall, F1, and ROC–AUC
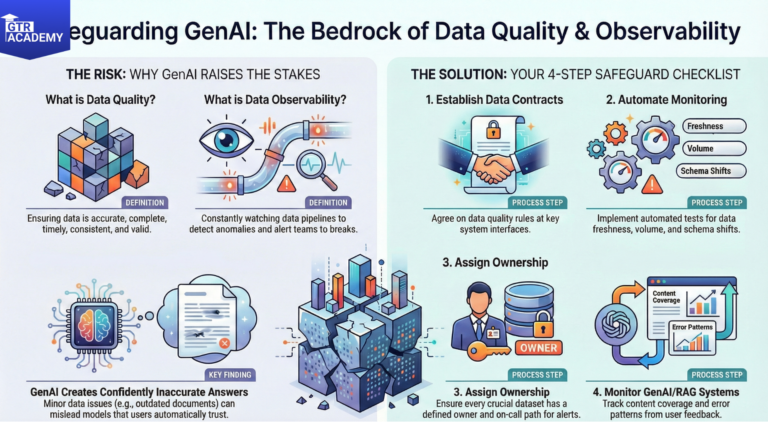
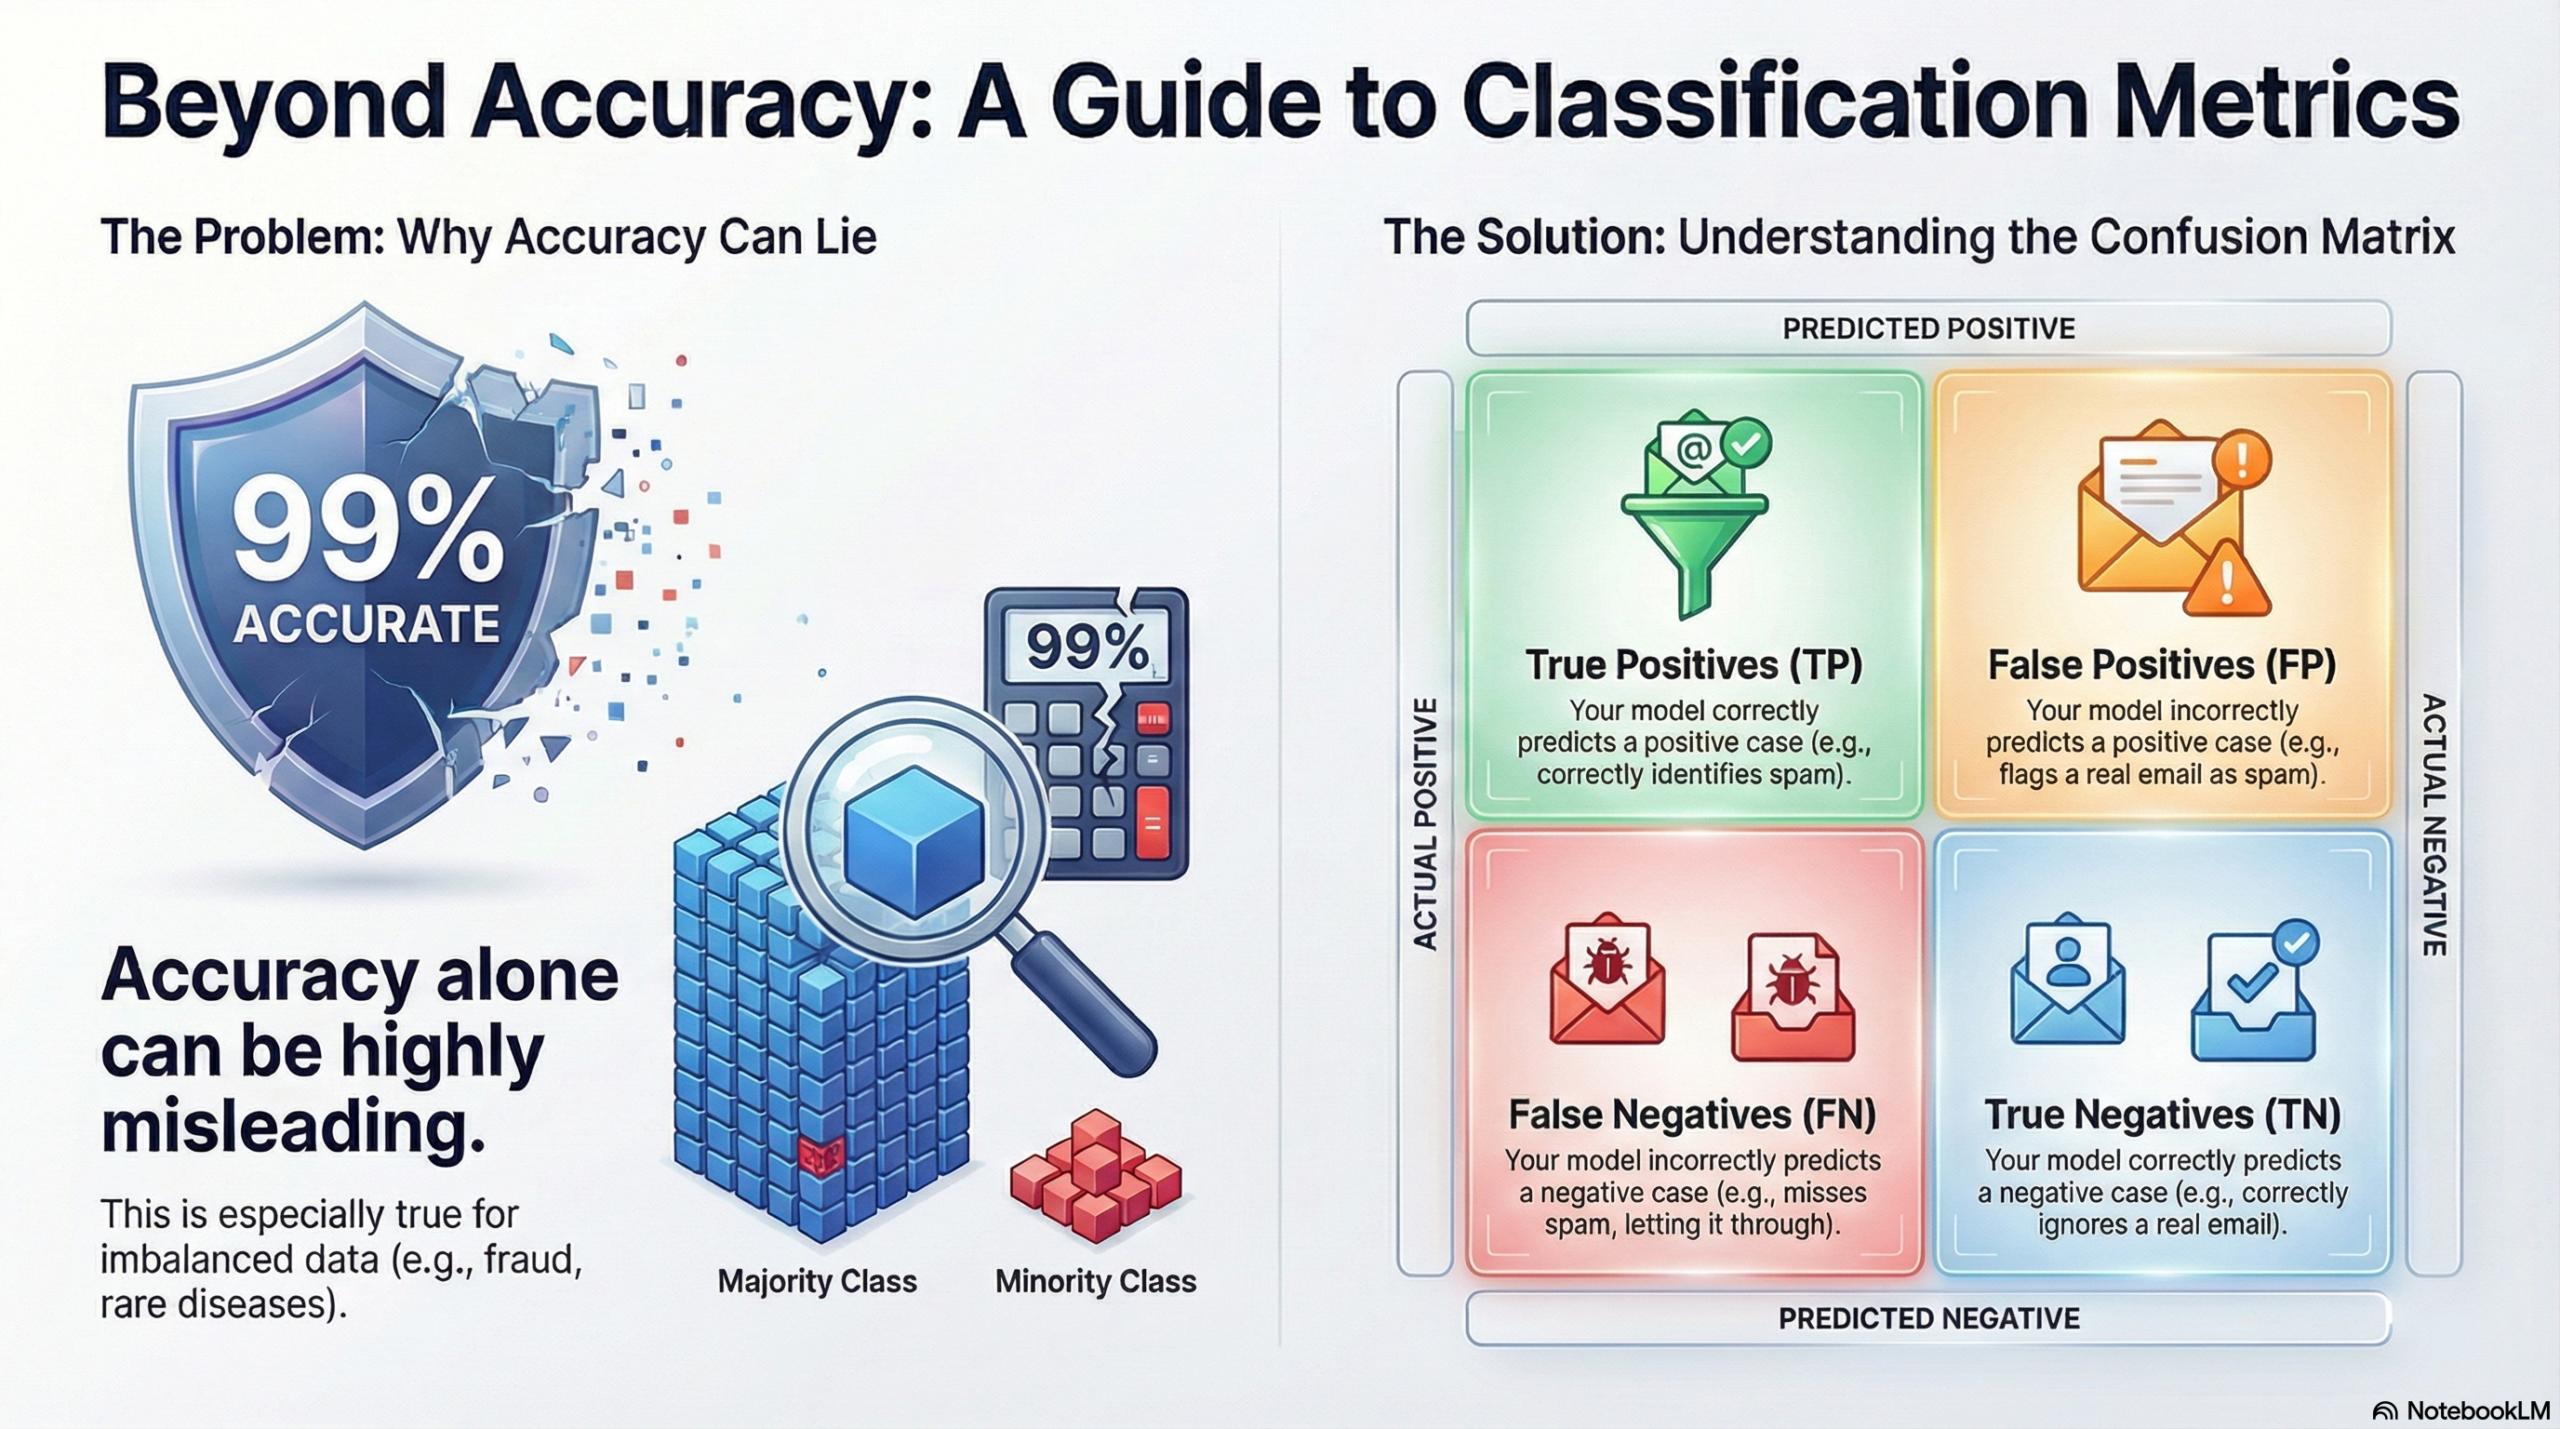
Accuracy alone can easily mislead the situation significantly, especially in cases of severely imbalanced data such as fraud, churn, or rare diseases. Confusion Matrix like precision, recall, F1, and ROC–AUC depict more clearly how your classifier works. Besides, you can provide the explanation of these metrics without using complex formulas.
Connect With Us: WhatsApp
Begin with the confusion matrix
These metrics derive from the four fundamental figures on the validation or test set:
- True positives (TP): positive cases that have been correctly predicted.
- False positives (FP): positives predicted, but in reality, they are negatives.
- True negatives (TN): negative cases that have been correctly predicted.
- False negatives (FN): negatives predicted, but in fact, they are positives.
Just by writing a simple spam detection or fraud alert use case in your blog, you can associate each of these with what is going on in that particular situation.
Precision and recall in plain language
Precision answers: “When the model predicts positive, how often is it right?” Recall answers: “Out of all actual positives, how many did the model catch?”
Precision = TP / (TP + FP)
Precision could be defined as zero false positive alarms since very few of such are present. For instance, in fraud detection, if precision is high, a flagged transaction is almost always a fraudulent one.
Recall = TP / (TP + FN)
A high recall value is an indication that there are very few cases that are missed. For example, in a disease screening scenario, high recall is equivalent to most sick patients being identified.
These two measures are usually at odds: using a more aggressive method increases recall but lowers precision, and conversely, decreasing recall increases precision.
F1 score: balancing precision and recall
- F1 is a mix of precision and recall in one figure achieved through the harmonic mean, thus yielding a high score only if both of them are reasonably high.
- It can be very nicely explained in your article like this:
- Once one of the precision or recall is high and the other low, F1 will be at a moderate level.
- F1 is a very good measuring tool when “positive” is a rare but very important class (fraud, churn, defects).
- Most of the experts decide on the model or the threshold that brings the highest F1 value performance if there is no strong inclination towards either precision or recall.
ROC–AUC in simple terms
Most classifiers come with probabilities as output, not just labels. By having different thresholds, one can achieve a trade-off between true positive rate (TPR) and false positive rate (FPR). The ROC curve is a graph of TPR against FPR at each threshold; ROC–AUC is the area under this curve.
A simple intuition for the blog:
- First of all, ROC–AUC is a metric that indicates how good the model is in ranking positive cases higher than negative ones when all thresholds are considered.
- An AUC of 0.5 ≈ random guessing; 1.0 = impeccable ranking; 0.7–0.9 is usually considered “good” depending on the field concerned.
- Also, you can talk about precision–recall (PR) curves which are more helpful than ROC in situations where the positive class is extremely rare.
Real-world scenarios to tie it together
Introduce several abbreviated situations so that visitors can relate metrics to decisions:
Email spam filter
- False positives are too many (low precision): Necessary emails go into spam.
- False negatives are too many (low recall): Spam is overflowing the inbox.
Business choice: Either establish a compromise through F1 or select a threshold that ensures a low level of complaints.
Connect With Us: WhatsApp
Medical diagnosis
- Most of the time, recall is preferred: The cost of missing a disease case can be very high.
- Nevertheless, precision should not be disregarded in order to prevent doctors from being flooded with false alarms.
- Metric choice: The focus should be on high recall, while F1 or PR–AUC could be used for model comparison.
Fraud detection
- Generally, you would like to have excellent ranking capability (high ROC–AUC) so that the cases with the highest scores are truly the riskiest ones.
- Afterward, you determine an operating point (threshold) according to the number of alerts that your team can handle.